As President Obama arrives in Phoenix tonight for a visit to Grand Canyon National Park tomorrow, the battle over uranium exploration has taken a new direction. According to an AP report in the Arizona Republic, the U.S. Forest Service is now examining existing mining claims to determine if they are valid.
If not, it seems the Forest Service will deny the claims, leaving the lands to be added to the million acres of federal lands segregated (effectively withdrawn) from new mining claims.
Based on the news reports I've read, it sounds like the Forest Service is accepting arguments that exploration drilling should only be allowed if a company can prove the mineral (uranium in this case) is present in mineable quantities. Does this mean that claims can only be valid based only on the surface expression of a mineral deposit? This sounds like a very aggressive action by the USFS. If mining companies cannot do the exploration needed to prove up the mineral reserves before making major investments it could effectively end any mining on Forest lands. Will BLM follow suit? USFS is part of the Agriculture Dept, while BLM is in Interior.
Kris Hefton, with VANE Minerals [right, uranium exploration drill hole in so. Utah. Credit, VANE Minerals], talked about this at the last AZ Geological Society meeting a couple weeks ago, but it's now becoming clearer what the potential impacts of the Forest Service action could be. VANE's claims are the first to be targeted by USFS.
Thursday, August 27, 2009
Earthquakes in Google Earth
A good habit I have acquired during the last months is to take a look to therecent seismic activity of a region before starting to work in there, in order to get a quick idea of what is going on. This habit can be more illustrating that it initially seems.
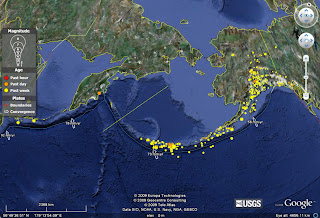
USGS provides a KMZ file with a very friendly and attractive interface for Google Earth. It loads the major earthquakes in our planet for the last 7 days, classified by time (Last hour, Last day, Last week), and by magnitude (from 1 to 8). If you click on each individual earthquake, you will open a box with its basic information and the url link for opening in your browser the complete information about it.
You can load this file in your Google Earth from the dedicated USGS website forseismology:
http://earthquake.usgs.gov/
It is on the left, "Google Earth KML". Anyway, the direct link to the file is:
http://earthquake.usgs.gov/eqcenter/catalogs/eqs7day-age.kmz
The interface also loads plate boundaries and convergence rates, measured in mm/year. I haven't found the source of the rates, but let's accept that if the data comes from USGS, should be fine. The plate boundaries included in the KMZ file are:
- Subduction zone.
- Oceanic transform fault.
- Oceanic spreading rift.
- Oceanic convergent boundary.
- Continental transform fault.
- Continental rift boundary.
- Continental convergent boundary.
 Of course, don't expect a very precise location for the plate boundaries! It is just an indication of the global tectonics of each area, in order to put the earthquakes in a correct geodynamic context.
Personally I find this KML file very useful, not only for the very up-to-the-date information given, but also for the boundaries, the rates... Useful thing when we have to prepare a simple figure in Corel or Freehand for a report.
Graphical templates for Structural Geology
We all need from time to time to print a stereographic projection net, aKalsbeek counting net or a rose diagram. Courtesy of Holcombe, Coughlin & Associates (http://www.holcombecoughlin.com) today we bring you a document (pdf format) with several graphical templates for structural geology(and mineralogy too!):http://www.holcombecoughlin.com/downloads/HCA_templates_for_structural_geologists.pdfThe content of the document includes the following diagrams:Stereographic projection nets (several sizes, 20 cm, 15 cm, 10 cm and 5 cm):- Lambert equal area projection (Schmidt net).- Polar equal area projection.- Equal angle projection (Wulff net).Rose diagram netKaalsbeek counting netA simple but very useful document, as we can have in a single pdf all the basic diagrams we can need in the field. Now print it and start to plot data!
Tuesday, August 25, 2009
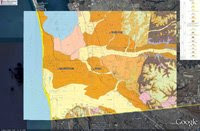
Reconnaissance Geology of the State of Baja California

Reconnaissance Geology of the State of Baja California
Saturday, August 1, 2009
Geology of San Diego


Subscribe to:
Posts (Atom)