What time is it??

Friday, October 1, 2010

Earth from space: Giant iceberg enters Nares Strait


ESA's Envisat satellite has been tracking the progression of the giant iceberg that calved from Greenland's Petermann glacier on 4 August 2010. This animation shows that the iceberg, the largest in the northern hemisphere, is now entering Nares Strait - a stretch of water that connects the Lincoln Sea and Arctic Ocean with Baffin Bay.

The Petermann glacier in northern Greenland is one of the largest of the country's glaciers - and until August it had a 70 km tongue of floating ice extending out into the sea. The glacier regularly advances towards the sea at about 1 km per year.

Earlier this year, satellite images revealed that several cracks had appeared. Envisat radar images showed that the ice tongue was still intact on 3 August but, on 4 August, a huge chunk had detached.

Calvings from the Petermann glacier are quite common, but one of this magnitude is rare. Less significant events took place in 2001, in 2008 when a 27 sq km iceberg made its way south to Davis Strait, and in 2009.


This iceberg is about 30 km long and 15 km wide at its foot and almost 7 km wide at its head, covering an area of around 245 sq km. By 22 August this giant mass of ice had been carried about 22 km from its birth place.

On 1 September imagery showed that the iceberg had travelled almost another 6 km from the edge of the glacier and rotated westward (about 39°), just tipping into Nares Strait. The animation also shows that the iceberg hit a small island, which may delay further progression for a short while and may also cause the iceberg to break.

It is expected that the iceberg will soon be fully in Nares Strait, but its course depends on winds blowing off the glacier and currents in the strait, as well as sea ice that could block its path.

The animation was generated from 21 Envisat Advanced Synthetic Aperture Radar (ASAR) Wide Swath Mode (spatial resolution 150 m × 150 m) and three ASAR Image Mode (spatial resolution 30 m × 30 m) images.

Note: This story has been adapted from a news release issued by the European Space Agency


Saturday, September 25, 2010

A tectonic zip

The complex fracture pattern created by the earthquake in ConcepciĆ³n (Chile) on 27 February 2010 was to a certain extent predictable. GPS observations from the years before the earthquake showed the pattern of stresses that had accumulated through the plate movements during the past 175 years in this area. The stress distribution derived from the observations correlates highly with the subsequent fracture distribution. In all likelihood the tremor removed all the stress that had accumulated since the last earthquake in this region, which was observed by Charles Darwin in 1835. An earthquake of similar magnitude in this area is therefore unlikely in the near future. This result was presented by scientists of the GFZ German Centre for Geosciences (Helmholtz Association) in the latest edition of the scientific journal Nature (09 September 2010).

"The Maule earthquake near ConcepciĆ³n, Chile, on the 27 Februar registered with a momentum magnitude of 8.8, makes it one of the largest earthquakes to have been recorded in its entirety via a modern network of space-geodetic and geophysical instruments on the ground," says Professor Onno Oncken, head of the Department "Geodynamics" at GFZ. "It thus offers a unique opportunity to compare detailed observations prior to the earthquake with those taken during and after it, and to re-evaluate hypotheses regarding the predictability of such events."

Measurements using the satellite navigation system GPS showed that the seafloor of the Nazca plate in the Pacific Ocean does not slide evenly under the western boundary of the South American continent. Rather, it appears from the GPS measurements that some parts of the ocean floor got locked with the subsurface of the continent. In the gaps, however, the Nazca plate continued to push under South America. The resulting uneven stress pattern was released by the earthquake of the 27 February in such a way that, just like a zipper, the locked patches were ruptured one after the other. As a result, this seismic gap off the Chilean westcoast is now closed, one last gap remains in northern Chile. Here, the GFZ scientists set up a plate boundary observatory, in order to make use of the entire range of geoscientific instruments to record the conditions before, during and after an earthquake- an important step in understanding the processes of plate tectonics.

Modern Earth science may still not be able to predict the location, time and magnitude of an earthquake. But the present study offers an optimistic perspective concerning the predictability of possible fracture patterns and magnitudes of expected earthquakes.

Note: This story has been adapted from a news release issued by the Helmholtz Association of German Research Centres

Tuesday, September 21, 2010

Glaciers help high-latitude mountains grow taller


Glaciers can help actively growing mountains become higher by protecting them from erosion, according to a University of Arizona-led research team.


The finding is contrary to the conventional view of glaciers as powerful agents of erosion that carve deep fjords and move massive amounts of sediment down mountains. Mountains grow when movements of the Earth's crust push the rocks up.

The research is the first to show that the erosion effect of glaciers - what has been dubbed the "glacial buzzsaw" - reverses on mountains in colder climates.

The researchers were surprised, said first author Stuart N. Thomson, a research scientist in the UA department of geosciences. "We were expecting to see the buzzsaw."

The team discovered the protective effects of glaciers by studying the Andes Mountains in the southernmost region of South America, known as Patagonia.

UA co-author Peter W. Reiners said, "It's been thought that glaciers limit the height of mountain ranges worldwide."

The key is climate. Glaciers atop mountains in temperate latitudes flow downhill, scouring away the surface of the mountain. Over millennia, such erosion can reduce the height and width of a mountain range by miles.

However in very cold climates such as the Patagonian Andes, rather than scraping away the surface of the mountain, the team found that glaciers protect the mountain top and sides from erosion.

The team dubs the action of the cold-climate glaciers "glacial armoring."

"Climate, especially through glaciers, has a really big impact on how big mountains get," said Reiners, a UA professor of geosciences.

"What we're seeing is that below certain latitudes, glacial buzzsaws clearly and efficiently operate, but south of about 45 degrees, it not only doesn't work - it has the opposite effect," he said. "The glaciers actually protect the surface and allow the mountains to grow higher."

He and his colleagues anticipate that glacial armoring also occurs on cold-climate mountains very far north, such as those in Alaska.

Thursday, July 8, 2010

A Grain of Sand Picture Gallery


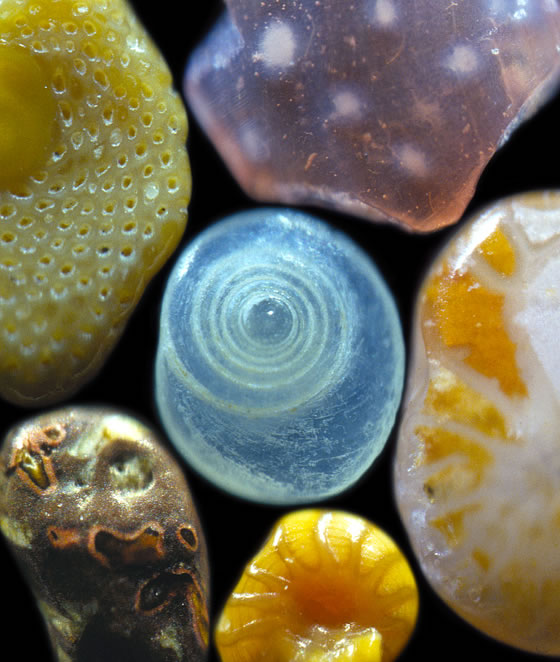
The tip of a spiral shell has broken off and become a grain of sand. It is opalescent from the repeated tumbling action of the surf. Surrounding the shell fragment are five other sand grains, from top middle clockwise, (1) a pink shell fragment, (2) a foram, (3) a microscopic shell, (4) a volcanic melt, and (5) a bit of coral. Image Copyright © 2008 Dr. Gary Greenberg, All Rights Reserved.


Sand from Skeleton Beach in Namibia contains rounded and polished pink-and-red garnet. Image Copyright © 2008 Dr. Gary Greenberg, All Rights Reserved.


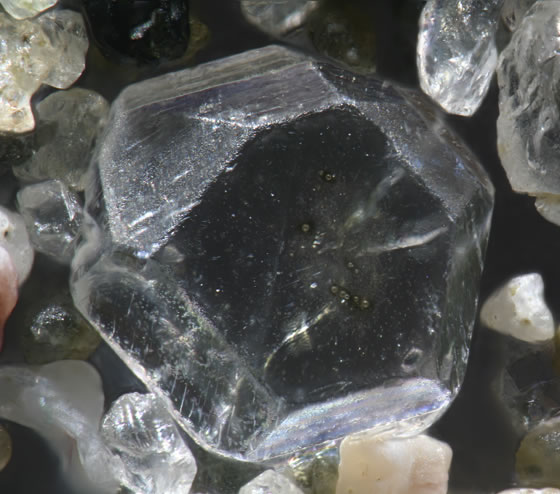
Sand from Zushi Beach, Japan, contains what looks like a sapphire crystal. The crystal is larger than the surrounding grains and has survived eroding because of its hardness and quality. Image Copyright © 2008 Dr. Gary Greenberg, All Rights Reserved.


The glacially deposited sands around Lake Winnibigoshish, Minnesota, contain abundant sediments from the igneous and metamorphic minerals of the Lake Superior basin. A sample includes pink garnets, green epidote, iron-rich red agates, black magnetite, and hematite. Image Copyright © 2008 Dr. Gary Greenberg, All Rights Reserved.

Monday, June 28, 2010

Privacy Policy

Privacy Policy for http://notes-of-geologist.blogspot.com/

If you require any more information or have any questions about our privacy policy, please feel free to contact us by email at panjoel_erep@gmail.com.

At http://notes-of-geologist.blogspot.com/, the privacy of our visitors is of extreme importance to us. This privacy policy document outlines the types of personal information is received and collected by http://notes-of-geologist.blogspot.com/ and how it is used.

Log Files
Like many other Web sites, http://notes-of-geologist.blogspot.com/ makes use of log files. The information inside the log files includes internet protocol ( IP ) addresses, type of browser, Internet Service Provider ( ISP ), date/time stamp, referring/exit pages, and number of clicks to analyze trends, administer the site, track user’s movement around the site, and gather demographic information. IP addresses, and other such information are not linked to any information that is personally identifiable.

Cookies and Web Beacons
http://notes-of-geologist.blogspot.com/ does use cookies to store information about visitors preferences, record user-specific information on which pages the user access or visit, customize Web page content based on visitors browser type or other information that the visitor sends via their browser.

DoubleClick DART Cookie
.:: Google, as a third party vendor, uses cookies to serve ads on http://notes-of-geologist.blogspot.com/.
.:: Google's use of the DART cookie enables it to serve ads to users based on their visit to http://notes-of-geologist.blogspot.com/ and other sites on the Internet.
.:: Users may opt out of the use of the DART cookie by visiting the Google ad and content network privacy policy at the following URL - http://www.google.com/privacy_ads.html

Some of our advertising partners may use cookies and web beacons on our site. Our advertising partners include ....
Google Adsense


These third-party ad servers or ad networks use technology to the advertisements and links that appear on http://notes-of-geologist.blogspot.com/ send directly to your browsers. They automatically receive your IP address when this occurs. Other technologies ( such as cookies, JavaScript, or Web Beacons ) may also be used by the third-party ad networks to measure the effectiveness of their advertisements and / or to personalize the advertising content that you see.

http://notes-of-geologist.blogspot.com/ has no access to or control over these cookies that are used by third-party advertisers.

You should consult the respective privacy policies of these third-party ad servers for more detailed information on their practices as well as for instructions about how to opt-out of certain practices. http://notes-of-geologist.blogspot.com/'s privacy policy does not apply to, and we cannot control the activities of, such other advertisers or web sites.

If you wish to disable cookies, you may do so through your individual browser options. More detailed information about cookie management with specific web browsers can be found at the browsers' respective websites.

Six Things to Know About the Earth's Mantle

The rocks and continents of the world belong to the Earth's crust. Beneath that crust is the Earth's mantle.

The mantle is the thick layer of hot, solid rock between the crust and the molten iron core. The mantle makes up the bulk of the Earth, accounting for two-thirds of its mass. The mantle starts about 30 kilometers down and is about 2900 kilometers thick.

Let's take a look at six different aspects of the mantle. Each of these six items links to an article with more detail.

1. Samples from the Mantle

Earth has the same recipe of elements as the Sun and the other planets (ignoring hydrogen and helium, which have escaped Earth's gravity). Subtracting the iron in the core, we can calculate that the mantle is a mix of magnesium, silicon, iron, and oxygen that roughly matches the composition of garnet.

Exactly what mix of minerals is present at a given depth is an intricate question that is not firmly settled. It helps that we have samples from the mantle, chunks of rock carried up in certain volcanic erup

tions, from as deep as about 300 kilometers. These show that the uppermost part of the mantle consists of the rock types peridotite and eclogite. But the most exciting thing we get from the mantle is diamonds.

2. Activity in the Mantle

The uppermost mantle is slowly stirred by the plate motions going on above it. The main activities are the downward motion of subducting plates and the upward motion of mantle rock at spreading centers. All this commotion does not mix the upper mantle thoroughly, however, and geochemists think of the upper mantle as a rocky version of marble cake.

The world's patterns of volcanism faithfully reflect plate tectonics, but not the centers of eruptive action called hotspots. Hotspots may be a clue to the rise and fall of material much deeper in the mantle, even from its very bottom. Or they may not. There is a vigorousscientific discussion about hotspots these days.

3. Exploring the Mantle with Earthquake Waves

Our most powerful tool for exploring the mantle is to monitor seismic waves from the world's earthquakes. The two different kinds of seismic wave, P waves (analogous to sound waves) and S waves (like the waves in a shaken rope), respond to the physical properties of the rocks they go through. Like light waves, they reflect off density boundaries and refract in rocks of different density. We use these effects to map the Earth's insides.

Our tools are good enough to treat the Earth's mantle the way doctors make ultrasound pictures of their patients. After a century of collecting earthquakes, we're able to makesome impressive maps of the mantle.

4. Modeling the Mantle in the Laboratory

With the human body, ultrasound images are just shadows unless we have hands-on knowledge of what is beneath the skin. The same is true of seismic mantle maps. Minerals and rocks change under high pressure. For instance, the common mantle mineral olivinechanges to different crystal forms at depths of around 410 and 660 kilometers.

We study the behavior of minerals under conditions in the mantle with two methods: calculations based on the equations of mineral physics and laboratory experiments. Thus mantle studies are a three-way conversation of seismologists, computer programmers and lab researchers who can now reproduce conditions anywhere in the mantle with high-pressure laboratory equipment like the diamond-anvil cell.

5. The Mantle's Layers and Internal Boundaries

Over the last century, seismic data has let us fill some of the blanks in the mantle. It has three main layers. The upper mantle extends from the base of the crust down to 660 kilometers depth. Many workers distinguish the transition zone between 410 and 660 kilometers, two depths at which major physical changes occur to minerals.

The lower mantle extends from 660 down to about 2700 kilometers, a point where seismic waves are affected so strongly that most researchers believe the rocks beneath are chemically different. This controversial layer at the bottom of the mantle, about 200 kilometers thick, has the odd name "D-double-prime." Read more of what we've learnedabout these layers and the crucial boundaries between them.

6. Why Earth's Mantle Is Special

Because the mantle is the bulk of the Earth, its story is fundamental to geology. The mantle began, during Earth's birth, as an ocean of magma atop the iron core. As it solidified, elements that didn't fit into the major minerals collected as a scum on top—the crust. After that the mantle began the slow circulation it has had for the last 4 billion years, with at least the upper part being cooled, stirred and hydrated by the tectonic motions of the surface plates.

At the same time, we have learned a great deal about the structure of Earth's sister planets Mercury, Venus and Mars. Compared to them, Earth has an active, lubricated mantle that is very special thanks to the same ingredient that distinguishes its surface: water.

Tuesday, June 15, 2010

The Earth Core

A century ago, science barely knew that the Earth even has a core. Today we are tantalized by the core and its connections with the rest of the planet. Indeed, we're at the start of a golden age of core studies.

The Core's Gross Shape

We knew by the 1890s, from the Earth's response to the gravity of the Sun and Moon, that the planet has a dense core, probably iron. In 1906 Richard Dixon Oldham found that earthquake waves move through the Earth's center much slower than through the mantle around it—because the center is liquid.

In 1936 Inge Lehmann reported that something reflects seismic waves from within the core. It became clear that the core consists of a thick shell of liquid iron—the outer core—with a smaller, solid inner core at its center. It's solid because at that depth the high pressure overcomes the effect of high temperature.

In 2002 Miaki Ishii and Adam Dziewonski of Harvard University published evidence of an "innermost inner core" some 600 kilometers across. In 2008 Xiadong Song and Xinlei Sunproposed a different inner inner core about 1200 km across (here's a condensed version in scientific jargon). Not much can be made of these ideas until others confirm the work.

Whatever we learn raises new questions. The liquid iron must be the source of Earth's geomagnetic field—the geodynamo—but how does it work? Why does the geodynamo flip, switching magnetic north and south, over geologic time? What happens at the top of the core, where molten metal meets the rocky mantle? Answers began to emerge during the 1990s.

Studying the Core

Our main tool for core research has been earthquake waves, especially those from large events like the 2004 Sumatra quake. The ringing "normal modes," which make the planet pulsate with the sort of motions you see in a large soap bubble, are useful for examining large-scale deep structure.

But a big problem is nonuniqueness—any given piece of seismic evidence can be interpreted more than one way. A wave that penetrates the core also traverses the crust at least once and the mantle at least twice, so a feature in a seismogram may originate in several possible places. Many different pieces of data must be cross-checked.

The barrier of nonuniqueness faded some as we began to simulate the deep Earth in computers with realistic numbers, and as we reproduced high temperatures and pressures in the laboratory with the diamond-anvil cell. These tools have let us peer through the layers of the Earth until at last we can contemplate the core.

What the Core Is Made Of

Considering that the whole Earth on average consists of the same mixture of stuff we see elsewhere in the solar system, the core must be iron metal along with some nickel. But it's less dense than pure iron, so about 10 percent of the core must be something lighter. Sulfur and oxygen are the two best candidates, though hydrogen has also been considered. But the money is still on one of the other two, with oxygen looking slightly more probable, or maybe both.

Seismologists continue to probe the inner core. The core's eastern hemisphere appears to differ from the western hemisphere in the way the iron crystals are aligned. The problem is hard to attack because seismic waves have to go pretty much straight from an earthquake, right through the Earth's center, to a seismograph. Events and machines that happen to be lined up just right are rare. And the effects are subtle.

Core Dynamics

In 1996, Xiadong Song and Paul Richards confirmed a prediction that the inner core rotates slightly faster than the rest of the Earth. The magnetic forces of the geodynamo seem to be responsible.

Over geologic time, the inner core grows as the whole Earth cools. Iron crystals freeze out at the top of the outer core and rain onto the inner core. At the base of the outer core, the iron freezes under pressure taking much of the nickel with it. The remaining liquid iron is lighter and rises. These rising and falling motions, interacting with geomagnetic forces, stir the whole outer core at a speed of 20 kilometers a year or so.

The planet Mercury also has a large iron core and a magnetic field, though much weaker than Earth's. Recent research hints that Mercury's core is rich in sulfur and that a similar freezing process stirs it, with "iron snow" falling and sulfur-enriched liquid rising.

Core studies surged in 1996 when computer models by Gary Glatzmaier and Paul Roberts first reproduced the behavior of the geodynamo, including spontaneous reversals. Hollywood gave Glatzmaier an unexpected audience when it used his animations in the action movie The Core.

Recent high-pressure lab work by Raymond Jeanloz, Ho-Kwang (David) Mao and others has given us hints about the core-mantle boundary, where liquid iron interacts with silicate rock. The experiments show that core and mantle materials undergo strong chemical reactions. This is the region where many think mantle plumes originate, rising to form places like the Hawaiian Islands chain, Yellowstone, Iceland, and other surface features. The more we learn about the core, the closer it becomes.

Monday, May 17, 2010

The Pacific Ocean Tsunami Threat is Higher Than Expected

Potential of Future Tsunamis


The potential for a huge Pacific Ocean tsunami on the West Coast of North America may be greater than previously thought.

The new study of geological evidence along the Gulf of Alaska coast suggests that future tsunamis could reach a scale far beyond that suffered in the tsunami generated by the great 1964 Alaskan earthquake. Official figures put the number of deaths caused by the earthquake at around 130: 114 in Alaska and 16 in Oregon and California. The tsunami killed 35 people directly and caused extensive damage in Alaska, British Columbia, and the US Pacific region*.

The 1964 Alaskan earthquake - the second biggest recorded in history with a magnitude of 9.2 - triggered a series of massive waves with run up heights of as much as 12.7 metres in the Alaskan Gulf region and 52 metres in the Shoup Bay submarine slide in Valdez Arm.

The study suggests that rupture of an even larger area than the 1964 rupture zone could create an even bigger tsunami. Warning systems are in place on the west coast of North America but the finding

Evaluation of Ancient Earthquakes


The research team from Durham University in the UK, the University of Utah and Plafker Geohazard Consultants, gauged the extent of earthquakes over the last 2,000 years by studying subsoil samples and sediment sequences at sites along the Alaskan coast. The team radiocarbon-dated peat layers and sediments, and analysed the distribution of mud, sand and peat within them. The results suggest that earthquakes in the region may rupture even larger segments of the coast and sea floor than was previously thought.

The study published in the academic journal Quaternary Science Reviews and funded by the National Science Foundation, NASA, and the US Geological Survey shows that the potential impact in terms of tsunami generation, could be significantly greater if both the 800-km-long 1964 segment and the 250-km-long adjacent Yakataga segment to the east were to rupture simultaneously.

Larger Ancient Earthquakes

Lead author, Professor Ian Shennan, from Durham University's Geography Department said: "Our radiocarbon-dated samples suggest that previous earthquakes were fifteen per cent bigger in terms of the area affected than the 1964 event. This historical evidence of widespread, simultaneous plate rupturing within the Alaskan region has significant implications for the tsunami potential of the Gulf of Alaska and the Pacific region as a whole."

"Peat layers provide a clear picture of what's happened to the Earth. Our data indicate that two major earthquakes have struck Alaska in the last 1,500 years and our findings show that a bigger earthquake and a more destructive tsunami than the 1964 event are possible in the future. The region has been hit by large single event earthquakes and tsunamis before, and our evidence indicates that multiple and more extensive ruptures can happen."


Causes of a Tsunami


Tsunamis can be created by the rapid displacement of water when the sea floor lifts and/or falls due to crustal movements that accompany very large earthquakes. The shallow nature of the sea floor off the coast of Alaska could increase the destructive potential of a tsunami wave in the Pacific.


Earthquake behaviour is difficult to predict in this region which is a transition zone between two of the world's most active plate boundary faults; the Fairweather fault, and the Aleutian subduction zone. In 1899 and 1979, large earthquakes occurred in the region but did not trigger a Tsunami because the rupturing was localized beneath the land instead of the sea floor.

Prof Ron Bruhn from the University of Utah said: "If the larger earthquake that is suggested by our work hits the region, the size of the potential tsunami could be signficantly larger than in 1964 because a multi-rupture quake would displace the shallow continental shelf of the Yakutat microplate."

"In the case of a multi-rupture event, the energy imparted to the tsunami will be larger but spread out over a longer strike distance. Except for the small communities at the tsunami source in Alaska, the longer length will have more of an effect on areas farther from the source such as southeastern Alaska, British Columbia, and the US west coast from Washington to California."


Tsunami Warning Systems


Warning systems have been in place on the US western seaboard and Hawaii since the 1946 Aleutian Islands tsunami. Improvements were made following the 2004 earthquake under the Indian Ocean that triggered the most deadly tsunami in recorded history, killing more than 230,000 people.

Prof Shennan said: "Earthquakes can hit at any time of the day or night, and that's a big challenge for emergency planners. A tsunami in this region could cause damage and threaten life from Alaska to California and beyond; in 1964 the effects of the tsunami waves were felt as far away as southern California and were recorded on tide gages throughout the Pacific Ocean."

Dr George Plafker from Plafker Geohazard Consultants said: "A large scale earthquake will not necessarily create a large wave. Tsunami height is a function of bathymetry, and the amount of slip and dip of the faults that take up the displacement, and all these factors can vary greatly along the strike."

"Tsunamis will occur in the future. There are issues in warning and evacuating large numbers of people in coastal communities quickly and safely. The US has excellent warning systems in place but awareness is vital."

Friday, May 14, 2010

Mega Tsunamis

How Mega Tsunamis Are Formed?
An "Ultrasound" of the Nankai Trough


Research by a team of United States and Japanese geoscientists may help explain why part of the seafloor near the southwest coast of Japan is particularly good at generating devastating tsunamis, such as the 1944 Tonankai event, which killed at least 1,200 people. The findings will help scientists assess the risk of mega tsunamis in other regions of the world.

Geoscientists from The University of Texas at Austin and colleagues used a commercial ship to collect three-dimensional seismic data that reveals the structure of Earth’s crust below a region of the Pacific seafloor known as the Nankai Trough. The resulting images are akin to ultrasounds of the human body.

The results, published in the journal Science, address a long standing mystery as to why earthquakes below some parts of the seafloor form large tsunamis while earthquakes in other regions do not.


How Mega Tsunamis Are Formed

The 3D seismic images allowed the researchers to reconstruct how layers of rock and sediment have cracked and shifted over time. They found two things that contribute to mega tsunamis. First, they confirmed the existence of a major fault that runs from a region known to unleash earthquakes about 10 kilometers (6 miles) deep right up to the seafloor. When an earthquake happens, the fault allows it to reach up and move the seafloor up or down, carrying a column of water with it and setting up a series of tsunami waves that spread outward.

Second, and most surprising, the team discovered that the recent fault activity, probably including the slip that caused the 1944 event, has shifted to landward branches of the fault, becoming shallower and steeper than it was in the past.

“That leads to more direct displacement of the seafloor and a larger vertical component of seafloor displacement that is more effective in forming tsunamis,” said Nathan Bangs, senior research scientist at the Institute for Geophysics at The University of Texas at Austin who was co-principal investigator on the research project and co-author on the Science article.


The Nankai Trough

The Nankai Trough is a subduction zone, an area where tectonic plates converge with one sinking as it passes below the other. Where steady movement is somehow impeded, elastic rock strains build up to the point that rupture occurs with the release of seismic energy. Subduction zones are the sites of the world's largest earthquakes.

In 2002, a team of researchers led by Jin-Oh Park at Japan Marine Science and Technology Center (JAMSTEC) had identified the fault, known as a megathrust or megasplay fault, using less detailed two-dimensional geophysical methods. Based on its location, they suggested a possible link to the 1944 event, but they were unable to determine where faulting has been recently active.


Fault Slip & the 1944 Tonankai Earthquake

“What we can now say is that slip has very recently propagated up to or near to the seafloor, and slip along these thrusts most likely formed the large tsunami during the 1944 Tonankai 8.1 magnitude event,” said Bangs.

The images produced in this project will be used by scientists in the Nankai Trough Seismogenic Zone Experiment (NanTroSEIZE), an international effort designed to, for the first time, “drill, sample and instrument the earthquake-causing, or seismogenic portion of Earth’s crust, where violent, large-scale earthquakes have occurred repeatedly throughout history.”


Determining Tsunami Potential

“The ultimate goal is to understand what’s happening at different margins,” said Bangs. “The 2004 Indonesian tsunami was a big surprise. It’s still not clear why that earthquake created such a large tsunami. By understanding places like Nankai, we’ll have more information and a better approach to looking at other places to determine whether they have potential. And we’ll be less surprised in the future.”

Bangs’ co-principal investigator was Gregory Moore at JAMSTEC in Yokohama and the University of Hawaii, Honolulu. The other co-authors are Emily Pangborn at the Institute for Geophysics at The University of Texas at Austin, Asahiko Taira and Shin'ichi Kuramoto at JAMSTEC and Harold Tobin at the University of Wisconsin, Madison. Funding for the project was provided by the National Science Foundation, Ocean Drilling Program and Japanese Ministry of Education, Culture, Sports and Technology.

Wednesday, May 5, 2010

The causes of tsunami

What causes a tsunami?... A tsunami is a large ocean wave that is caused by sudden motion on the ocean floor. This sudden motion could be an earthquake, a powerful volcanic eruption, or an underwater landslide. The impact of a large meteorite could also cause a tsunami. Tsunamis travel across the open ocean at great speeds and build into large deadly waves in the shallow water of a shoreline.

Subduction Zones are Potential Tsunami Locations

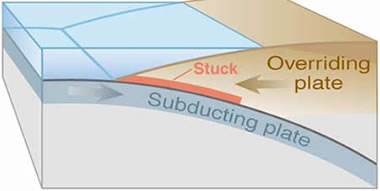
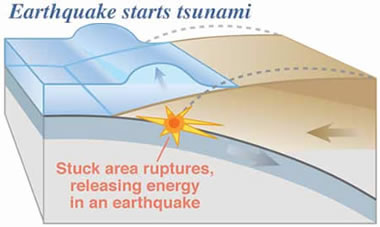
Most tsunamis are caused by earthquakes generated in a subduction zone, an area where an oceanic plate is being forced down into the mantle by plate tectonic forces. The friction between the subducting plate and the overriding plate is enormous. This friction prevents a slow and steady rate of subduction and instead the two plates become "stuck".


Image by USGS


Accumulated Seismic Energy

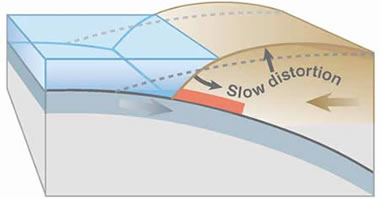
As the stuck plate continues to descend into the mantle the motion causes a slow distortion of the overriding plage. The result is an accumulation of energy very similar to the energy stored in a compressed spring. Energy can accumulate in the overriding plate over a long period of time - decades or even centuries.


Image by USGS


Earthquake Causes Tsunami

Energy accumulates in the overriding plate until it exceeds the frictional forces between the two stuck plates. When this happens, the overriding plate snaps back into an unrestrained position. This sudden motion is the cause of the tsunami - because it gives an enormous shove to the overlying water. At the same time, inland areas of the overriding plate are suddenly lowered.


Image by USGS


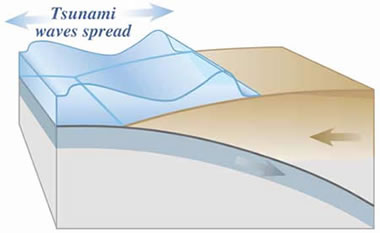
Tsunami Races Away From the Epicenter

The moving wave begins travelling out from where the earthquake has occurred. Some of the water travels out and across the ocean basin, and, at the same time, water rushes landward to flood the recently lowered shoreline.


Image by USGS


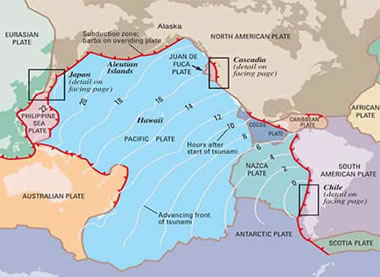
Tsunamis Travel Rapidly Across Ocean Basis

Tsunamis travel swiftly across the open ocean. The map below shows how a tsunami produced by an earthquake along the coast of Chile in 1960 traveled across the Pacific Ocean, reaching Hawaii in about 15 hours and Japan in less than 24 hours.


Image by USGS


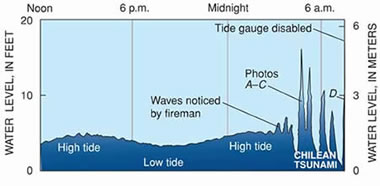
Tsunami "Wave Train"

Many people have the mistaken belief that tsunamis are single waves. They are not. Instead tsunamis are "wave trains" consisting of multiple waves. The chart below is a tidal gauge record from Onagawa, Japan beginning at the time of the 1960 Chile earthquake. Time is plotted along the horizontal axis and water level is plotted on the vertical axis. Note the normal rise and fall of the ocean surface, caused by tides, during the early part of this record. Then recorded are a few waves a little larger than normal followed by several much larger waves. In many tsunami events the shoreline is pounded by repeated large waves.


Image by USGS

The material above describes how tsunamis are generated and how they travel rapidly across an ocean basin. For more detailed information on this topic the following websites are recommended.

Thursday, April 8, 2010

Sedimentary structures and bedding style (part II)

Graded bedding. Graded bedding results from a rapid decrease in flow velocity that causes sediment to drop out of suspension. Larger particles settle fastest, therefore they accumulate at the bottom of the bed. Houcheng Formation, Jurassic, Hebei Province, China.
undefined

Graded beds, flame structures. Rapid sediment fallout from suspension often loads underlying fine-grained sediment to the point of failure, causing foundering of the overlying sediment and formation of structures termed flames (for obvious reasons!). Permian, Inyo County, California.
undefined

Flame Structure. The flame structures underlying this thick sandstone bed are evidence for rapid sand depostion; these sandstone beds are in fact sublacustrine turbidites. Cretaceous, Hebei Province, China.
undefined

Imbrication. Disk-shaped gravel clasts that are transported by rolling often "shingle" themselves to form a fabric termed imbrication. Individual clasts dip upflow. Current in this photo is from left to right (click to enlarge!). Owens Valley, California.
undefined

Graded and imbricated bed. OK, now I'm just getting redundant, but here you are anyways. Trail Canyon alluvial fan, Death Valley, California.
undefined

Flute casts. Flutes are caused by erosional eddies at the base of a turbulent flow. The deepest scour is on the upstream end of the flute, and the scours widen and become shallower downflow. Shiguai Formation, Inner Mongolia, China.

Gutter casts. Gutter casts are formed by entrained particles dragging along the base of a bed and leaving a track in their wake. These gutters were formed by wood fragments draggeing along the base of a river bed.Chengde Formation, Jurassic, Hebei province, China.
undefined

Dessication cracks. Mudcracks can become very large, which may make them difficult to recognize in small outcrops. Person for scale. Jixian Formation, Proterozoic, China.

Dessication cracks. A modern example. These are up to 1 m deep, and form polygonal networks that are often difficult to see except from the air! Panamint Valley, California.
undefined

Linguloid Ripples. These mud-draped ripples are linguloid in form, indicating shallow, rapid flow within the ripple stability field.Permian, Inner Mongolia, China.
undefined

Debris flow deposit. This type of non-erosive, unstructured and unsorted bed is typical of cohesive debris flow deposits. Coffin Canyon Fan, Death Valley, California.
undefined

Debris flow deposit. Oversized clasts "floating" in a mud-rich matrix are also typical of such flows. Coffin Canyon Fan, Death Valley, California.
undefined

Slump Deposit. Chaotic deposits such as these indicate slope failure. Cretaceous, Hebei province, China.
undefined

Monday, April 5, 2010

Sedimentary structures and bedding style (part I)

another picture of sedimentary structure and bedding style:

Wedge bedding. Successive stack of erosive-based channels creates wedge-shaped bedding cross-sections. Shiguai Formation, Inner Mongolia, China.
undefined

Channelized bedding. Erosive scours that backfill with sand may give rise to isolated channelized sandbodies such as this. Mesa Verde Group, Utah.
undefined

Tabular cross-bedding. These steep foresets are typical of eolian deposition. Late Jurassic, Liaoning Province, China.
undefined

Trough cross-bedding. Trough cross bedding is produced by the downflow migration of lunate dunes in both subaqueous and subaerial environments. Triassic, Hebei Province, China.
undefined

Trough cross-bedding. This unusual view is of mud-draped gravel foresets cut by a joint that is oriented parallel to bedding. We are looking down at a cut-away view of an originally horizontal surface. The arcuate surfaces shown were mud drapes on the downstream sides of gravel lunate dunes. Hammer handle points downflow. Note also the wood fragment oriented parallel to flow (just to the left of the hammer handle), and a second set of mud-draped forsets that is cut off by the bottom edge of the photograph.
undefined

Wave Ripples. Cross-sectional view of ripple cross-laminated sandstone, showing bi-directional cross laminae indicative of a wave origin. Entrada Formation, Jurassic, San Rafael Swell, Utah.

Ripple Marks. A pile of eroded, rippled beds that all contain gorgeous ripple marks. If you click on nothing else, click to enlarge this one!Carmel Formation, Utah.

Herrigbone cross-stratification. Bi-directional cross beds such as these are indicative of a tidal origin. Curtis Formation, Jurassic, Utah.
undefined

Gilbert Delta foresets. These are composite, large-scale foresets that indicate depostion into still water. The height of the foresets indicates the still water depth. Mecca Formation, California.
undefined

Climbing current ripples. Ripple foresets that "climb" on the backs of their predecessors are indicative of waning flow conditions and rapid sediment fallout, such that sediment drops out of suspension as fast as it can be molded into a bedform. Entrada Formation, Jurassic, Utah.

Climbing current ripples and convolute lamination. The result of rapid sediment fallout is often instability due to liquefaction, leading to disruption of laminae by water escape. Such disruption is termed convolute lamination. Modern Colorado River, Utah.
undefined