What time is it??

Thursday, December 24, 2009

Earth Core and Magnetic Field

Earth: Our Dynamic Planet


"Terra firma." It's Latin for "solid Earth." Most of the time, at least from our perspective here on the ground, Earth seems to be just that: solid. Yet the Earth beneath our feet is actually in constant motion. It moves through time and space, of course, along with the other objects in the universe, but it moves internally as well. The powerful forces of wind, water and ice constantly erode its surface, redistributing Earth's mass in the process.

Within Earth's solid crust, faulting literally creates and then moves mountains. Hydrological changes, such as the pumping of groundwater for use by humans, cause the ground beneath us to undulate. Volcanic processes deform our planet and create new land. Landslides morph and scar the terrain. Entire continents can even rise up, rebounding from the weight of massive glaciers that blanketed the land thousands of years ago.


A Need for Indirect Measurements


Indeed, the outermost layers of the celestial blue onion that is Earth-its crust and upper mantle-aren't very solid at all. But what happens if we peel back the layers and examine what's going on deep within Earth, at its very core? Obviously, Earth's core is too deep for humans to observe directly. But scientists can use indirect methods to deduce what's going on down there.

A new study in the journal Geophysical Research Letters, by Jean Dickey of NASA's Jet Propulsion Laboratory, Pasadena, California and co-author Olivier deViron of the Institut de Physique du Globe de Paris, University Paris Diderot, Centre National de la Recherche Scientifique, Paris, has confirmed previous theoretical predictions that the churning cauldron of molten metals that make up Earth's liquid outer core is slowly being stirred by a very complex but predictable series of periodic oscillations. The findings give scientists unique insights into Earth's internal structure, the strength of the mechanisms responsible for generating Earth's magnetic field and its geology.


Understanding Earth's "Layers"


In order to better understand what's going on inside our planet, it helps to first get a lay of the land, so to speak.

Earth has several distinct layers, each with its own properties. At the outermost layer of our planet is the crust, which comprises the continents and ocean basins. Earth's crust varies in thickness from 35 to 70 kilometers (22 to 44 miles) in the continents and 5 to 10 kilometers (3 to 6 miles) in the ocean basins. The crust is mainly composed of alumino-silicates.

Next comes the mantle. The mantle is roughly solid, though very slow motion can be observed inside of it. It is about 2,900 kilometers (1,800 miles) thick, and is separated into an upper and lower mantle. It is here where most of Earth's internal heat is located. Large convective cells in the mantle circulate heat and drive the movements of Earth's tectonic plates, upon which our continents ride. The mantle is mainly composed of ferro-magnesium silicates.

Earth's innermost layer is the core, which is separated into a liquid outer core and a solid inner core. The outer core is 2,300 kilometers (1,429 miles) thick, while the inner core is 1,200 kilometers (746 miles) thick. The outer core is mainly composed of a nickel-iron alloy (liquid iron), while the inner core is almost entirely composed of a pure solid iron body.


A Magnetic Field from a Churning Core


Scientists believe Earth's magnetic field results from movements of molten iron and nickel within its liquid outer core. These flows, which are caused by interactions between Earth's core and its mantle, are neither even, nor evenly distributed. The electrical currents generated by these flows result in a magnetic field, which is similarly uneven, moves around in location and varies in strength over time. Earth's magnetic field is also slightly tilted with respect to Earth's axis. This causes Earth's geographic north and south poles to not line up with its magnetic north and south poles--they currently differ by about 11 degrees.


Magnetic Reversals


In just the last 200 million years alone, Earth's magnetic poles have actually reversed hundreds of times, with the most recent reversal taking place about 790,000 years ago. Scientists are able to reconstruct the chronology of these magnetic pole reversals by studying data on the spreading of the seafloor at Earth's mid-oceanic ridges. Unlike the doomsday scenario popularized by Hollywood in the movie "2012," however, such reversals don't occur over days, but rather on geologic timescales spanning hundreds to thousands of years-very short in geologic time but comparatively long in human time. The time span between pole reversals is even longer, ranging from 100,000 to several million years.


Earth's Magnetic "Shield"


Earth's magnetic field is essential for life on Earth. Extending thousands of kilometers into space, it serves as a shield, deflecting the constant bombardment of charged particles and radiation known as the solar wind away from Earth. These solar winds would otherwise be fatal to life on Earth. At Earth's poles, the perpendicular angle of the magnetic field to Earth there allows some of these particles to make it into our atmosphere. This results in the Northern Lights in the northern hemisphere and the Southern Lights in the southern hemisphere.


Exploiting the Magnetic Field


Here on the ground, Earth's magnetic field has many practical applications to our everyday lives. It allows people to successfully navigate on land and at sea, making it a critical tool for commerce. Hikers use it to find their way. Archaeologists use it to deduce the age of ancient artifacts such as pottery, which, when fired, assumes the magnetic field properties that were present at the time of its creation. Similarly, the field of paleomagnetism uses magnetism to give scientists glimpses into Earth's remote past. In addition, geophysicists and geologists use geomagnetism as a tool to investigate Earth's structure and changes taking place in the Earth.


Indirectly Measuring Earth's Magnetic Field


Since Earth's liquid core is the primary source of Earth's magnetic field, scientists can use observations of the magnetic field at Earth's surface and its variability over time to mathematically calculate and isolate the approximate motions taking place within the core.

That's what Dickey and deViron did. They combined measurements of Earth's magnetic field taken by observatory stations on land and ships at sea dating back to 1840 with those of the Danish Oersted and German CHAMP geomagnetic satellite missions, both of which were supported by NASA investments. These measurements were then used as inputs for a complex model that employs statistical time series analyses to determine how fast liquid iron is flowing within Earth's core.

"Although we do not observe the core directly, it's amazing how much we can learn about Earth's interior using magnetic field observations," said Dickey.


Visualizing the Motion in Earth's Core


In order to approximate the flow of liquid in the core, the scientists visualized its motion as a set of 20 rigid cylinders, each rotating about a common point that represents Earth's axis. "Imagine that each cylinder is slowly rotating at a different speed, and you'll get a sense of the complex churning that's taking place within Earth's core," Dickey said.

The scientists analyzed the data to identify common patterns of movement among the different cylinders. These patterns represent how momentum and energy are transferred from the liquid core-mantle interface inward through the liquid core toward the inner core with diminishing amplitudes.


Oscillations in the Core


Their analyses isolated six slow-moving oscillations, or waves of motion, occurring within the liquid core. The oscillations originated at the boundary between Earth's core and its mantle and traveled inward toward the inner core with decreasing strength. Four of these oscillations were robust, occurring at periods of 85, 50, 35 and 28 years. Since the scientist's data set goes back to 1840, the recurrence period of the longest oscillation (85 years) is less well determined than the other oscillations. The last two oscillations identified were weaker and will require further study.

The 85- and 50-year oscillations are consistent with a 1997 study by researchers Stephen Zatman and Jeremy Bloxham of Harvard University, Cambridge, Mass., who used a different analysis technique. A later purely theoretical study by Harvard researcher Jon Mound and Bruce Buffett of the University of Chicago in 2006 showed that there should be several oscillations of this type; their predicted periods agree with the first four modes identified in Dickey and deViron's study.

"Our satellite-based results are in excellent agreement with the previous theoretical and other studies in this field, providing a strong confirmation of the existence of these oscillations," said Dickey. "These results will give scientists confidence in using satellite measurements in the future to deduce long-term changes taking place deep within our restless planet."

Saturday, December 19, 2009

African Rift

Part I. The East African Rift System


The East African Rift System (EARS) is one the geologic wonders of the world, a place where the earth's tectonic forces are presently trying to create new plates by splitting apart old ones. In simple terms, a rift can be thought of as a fracture in the earth's surface that widens over time, or more technically, as an elongate basin bounded by opposed steeply dipping normal faults. Geologists are still debating exactly how rifting comes about, but the process is so well displayed in East Africa (Ethiopia-Kenya-Uganda-Tanzania) that geologists have attached a name to the new plate-to-be; the Nubian Plate makes up most of Africa, while the smaller plate that is pulling away has been named the Somalian Plate (Figure 1). These two plates are moving away form each other and also away from the Arabian plate to the north. The point where these three plates meet in the Afar region of Ethiopia forms what is called a triple-junction. However, all the rifting in East Africa is not confined to the Horn of Africa; there is a lot of rifting activity further south as well, extending into Kenya and Tanzania and Great Lakes region of Africa. The purpose of this paper is to discuss the general geology of these rifts are and highlight the geologic processes involved in their formation.


What is the East Africa Rift System?


The oldest and best defined rift occurs in the Afar region of Ethiopia and this rift is usually referred to as the Ethiopian Rift. Further to the South a series of rifts occur which include a Western branch, the "Lake Albert Rift" or "Albertine Rift" which contains the East African Great Lakes, and an Eastern branch that roughly bisects Kenya north-to-south on a line slightly west of Nairobi (Figure 2). These two branches together have been termed the East African Rift (EAR), while parts of the Eastern branch have been variously termed the Kenya Rift or the Gregory Rift (after the geologist who first mapped it in the early 1900's). The two EAR branches are often grouped with the Ethiopian Rift to form the East Africa Rift System (EARS). The complete rift system therefore extends 1000's of kilometers in Africa alone and several 1000 more if we include the Red Sea and Gulf of Aden as extensions. In addition there are several well-defined but definitely smaller structures, called grabens, that have rift-like character and are clearly associated geologically with the major rifts. Some of these have been given names reflecting this such as the Nyanza Rift in Western Kenya near Lake Victoria. Thus, what people might assume to be a single rift somewhere in East Africa is really a series of distinct rift basins which are all related and produce the distinctive geology and topography of East Africa.


How did these Rifts form?


The exact mechanism of rift formation is an on-going debate among geologists and geophysicists. One popular model for the EARS assumes that elevated heat flow from the mantle (strictly the asthenosphere) is causing a pair of thermal "bulges" in central Kenya and the Afar region of north-central Ethiopia. These bulges can be easily seen as elevated highlands on any topographic map of the area (Figure 1). As these bulges form, they stretch and fracture the outer brittle crust into a series of normal faults forming the classic horst and graben structure of rift valleys (Figure 3). Most current geological thinking holds that bulges are initiated by mantle plumes under the continent heating the overlying crust and causing it to expand and fracture. Ideally the dominant fractures created occur in a pattern consisting of three fractures or fracture zones radiating from a point with an angular separation of 120 degrees. The point from which the three branches radiate is called a "triple junction" and is well illustrated in the Afar region of Ethiopia (Figure 4), where two branches are occupied by the Red Sea and Gulf of Aden, and the third rift branch runs to the south through Ethiopia.

The stretching process associated with rift formation is often preceded by huge volcanic eruptions which flow over large areas and are usually preserved/exposed on the flanks of the rift. These eruptions are considered by some geologists to be "flood basalts" - the lava is erupted along fractures (rather than at individual volcanoes) and runs over the land in sheets like water during a flood. Such eruptions can cover massive areas of land and develop enormous thicknesses (the Deccan Traps of India and the Siberian Traps are examples). If the stretching of the crust continues, it forms a "stretched zone" of thinned crust consisting of a mix of basaltic and continental rocks which eventually drops below sea level, as has happened in the Red Sea and Gulf of Aden. Further stretching leads to the formation of oceanic crust and the birth of a new ocean basin.


Part II. The East African Rift


If the rifting process described occurs in a continental setting, then we have a situation similar to what is now occurring in Kenya where the East African/Gregory Rift is forming. In this case it is referred to as "continental rifting" (for obvious reasons) and provides a glimpse into what may have been the early development of the Ethiopian Rift.

As mentioned in Part I, the rifting of East Africa is complicated by the fact that two branches have developed, one to the west which hosts the African Great Lakes (where the rift filled with water) and another nearly parallel rift about 600 kilometers to the east which nearly bisects Kenya north-to-south before entering Tanzania where it seems to die out (Figure 2). Lake Victoria sits between these two branches. It is thought that these rifts are generally following old sutures between ancient continental masses that collided billions of years ago to form the African craton and that the split around the Lake Victoria region occurred due to the presence of a small core of ancient metamorphic rock, the Tanzania craton, that was too hard for the rift to tear through. Because the rift could not go straight through this area, it instead diverged around it leading to the two branches that can be seen today.

As is the case in Ethiopia, a hot spot seems to be situated under central Kenya, as evidenced by the elevated topographic dome there (Figure 1). This is almost exactly analogous to the rift Ethiopia, and in fact, some geologists have suggested that the Kenya dome is the same hotspot or plume that gave rise to the initial Ethiopian rifting. Whatever the cause, it is clear that we have two rifts that are separated enough to justify giving them different names, but near enough to suggest that they are genetically related.


Other Points of Interest:


What else can we say about the Ethiopian and Kenya Rifts? Quite a lot actually; even though the Eastern and Western branches were developed by the same processes they have very different characters. The Eastern Branch is characterized by greater volcanic activity while the Western Branch is characterized by much deeper basins that contain large lakes and lots of sediment (including Lakes Tanganyika, the 2nd deepest lake in the world, and Malawi).

Recently, basalt eruptions and active crevice formation have been observed in the Ethiopian Rift which permits us to directly observe the initial formation of ocean basins on land. This is one of the reasons why the East African Rift System is so interesting to scientists. Most rifts in other parts of the world have progressed to the point that they are now either under water or have been filled in with sediments and are thus hard to study directly. The East African Rift System however, is an excellent field laboratory to study a modern, actively developing rift system.

This region is also important for understanding the roots of human evolution. Many hominid fossil finds occur within the rift, and it is currently thought that the rift's evolution may have played an integral role in shaping our development. The structure and evolution of the rift may have made East Africa more sensitive to climate changes which lead to many alternations between wet and arid periods. This environmental pressure could have been the drive needed for our ancestors to become bipedal and more brainy as they attempted to adapt to these shifting climates (see Geotimes 2008 articles: Rocking the Cradle of Humanity by Beth Christensen and Mark Maslin, and Tectonic Hypotheses of Human Evolution by M. Royhan Gani and Nahid DS Gani).


Conclusions:


The East African Rift System is a complicated system of rift segments which provide a modern analog to help us understand how continents break apart. It is also a great example of how many natural systems can be intertwined - this unique geological setting may have altered the local climate which may have in turn caused our ancestors to develop the skills necessary to walk upright, develop culture and ponder how such a rift came to be. Just like the Grand Canyon, the East African Rift System should be high on any geologist's list of geologic marvels to visit.

Tuesday, December 15, 2009

Question about "The Cracks" south of Holbrook

One of my blog posts from a number of weeks ago prompted this inquiry:
"About 15 miles south of Holbrook, AZ there are extremely deep fissures (referred to locally as "the Cracks") They range from just a few inches wide to several feet wide, but some seem to go down for a hundred feet. When you drop a rock in the crack you can hear it bouncing down the hole for an extremely long distance. Are these formed from seizmic [sic] activity?"

Actually, this area is pretty quiet seismically. But it is underlain by extensive salt and other evaporate minerals. As these deposits were dissolved over time, the overlying rocks dropped down, creating a broad anticlinal fold. This resulted in extension cracks over the top of the folded layers which have eroded into The Sinks and other similar features in the region.

We have a publication that describes the fractures and related topics with striking photos including the one above.


Friday, November 27, 2009

World's Biggest Tsunami

The largest recorded tsunami was a wave 1720 feet tall in Lituya Bay, Alaska

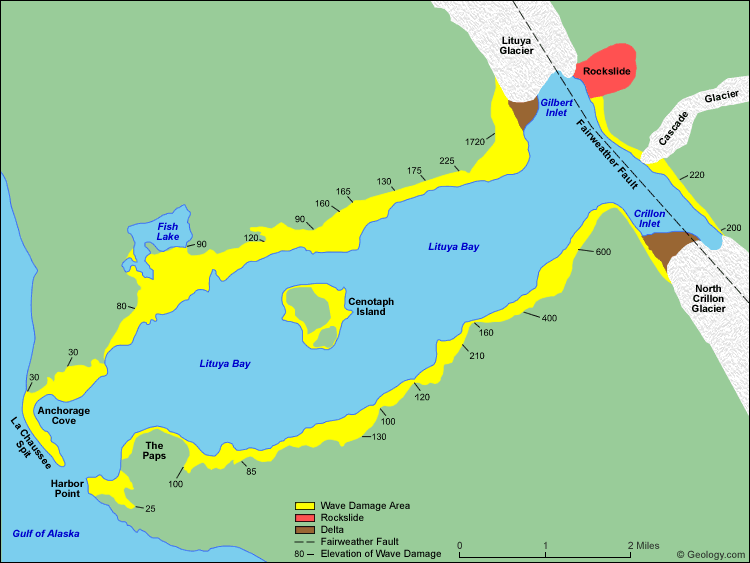
On the night of July 9, 1958 an earthquake along the Fairweather Fault in the Alaska Panhandle loosened about 40 million cubic yards (30.6 million cubic meters) of rock high above the northeastern shore of Lituya Bay. This mass of rock plunged from an altitude of approximately 3000 feet (914 meters) down into the waters of Gilbert Inlet (see map below). The impact generated a local tsunami that crashed against the southwest shoreline of Gilbert Inlet. The wave hit with such power that it swept completely over the spur of land that separates Gilbert Inlet from the main body of Lituya Bay. The wave then contiuned down the entire length of Lituya Bay, over La Chaussee Spit and into the Gulf of Alaska. The force of the wave removed all trees and vegetation from elevations as high as 1720 feet (524 meters) above sea level. Millions of trees were uprooted and swept away by the wave. This is the highest wave that has ever been known.


Detail Map: Lituya Bay, Alaska

Lituya Bay Map
Lituya Bay is an ice-scoured tidal inlet on the northeast shore of the Gulf of Alaska. It is about seven miles long (11.3 kilometers) and up to two miles wide (3.2 kilometers). It has a maximum depth of about 720 feet (219 meters) but a sill of only 32 feet (9.7 meters) in depth separates it from the Gulf of Alaska between La Chaussee Spit and Harbor Point.

The Fairweather Fault trends across the northeast end of the Bay and is responsible for the T-shape of the bay. Glacial scour has exploited the weak zone along the fault to produce a long linear trough known as the Fairweather Trench. The Lituya Glacier and North Crillon Glacier have scoured portions of the Fairweather Trench in the area of Lituya Bay. Gilbert Inlet and Crillon Inlet occupy the Fairweather Trench on the northeast end of Lituya Bay.

The rock fall of July 9, 1958 occurred on steep cliffs above the northeast shore of Gilbert Inlet. It is marked on the map above in red. The rocks fell from an elevation of about 3000 feet (914 meters). The impact of 40 million cubic yards (30.6 million cubic meters) of rock hitting the water produced a local tsunami that swept the entire length of the Lituya Bay and over the La Chaussee Spit. This wave stripped all vegetation and soil from along the edges of the bay. This damaged area is shown in yellow on the map above. The numbers are elevations (in feet) of the upper edge of the wave damage area and represent the approximate elevation of the wave as it traveled through the bay. Map redrawn from data included in United States Geological Survey Professional Paper 354-C.

Monday, November 23, 2009

How Fast Did the Andes Mountain Range Rise?

Introduction: Andes Mountain Range


Trailing like a serpent's spine along the western coast of South America, the Andes are the world's longest continental mountain range and the highest range outside Asia, with an average elevation of 13,000 feet.

The question of how quickly the mountains attained such heights has been a contentious one in geological circles, with some researchers claiming the central Andes rose abruptly to nearly their current height and others maintaining the uplift was a more gradual process.


Ancient Climate Change and Oxygen Isotopes


New research by U-M paleoclimatologist Christopher Poulsen and colleagues suggests that the quick-rise view is based on misinterpreted evidence. What some geologists interpret as signs of an abrupt rise are actually indications of ancient climate change, the researchers say. Their findings were published online April 1 in Science Express.

The confusion results when ratios of oxygen's two main isotopes, oxygen-18 and oxygen-16, are used to estimate past elevation, said Poulsen, an associate professor with appointments in the departments of Geological Sciences and Atmospheric, Oceanic, and Space Sciences.


Interpreting Oxygen Isotope Data


"In the modern climate, there is a well-known inverse relationship between oxygen isotopic values in rain and elevation," Poulsen said. "As a rain cloud ascends a mountain range, it begins to precipitate. Because oxygen-18 is more massive than oxygen-16, it is preferentially rained out. Thus, as you go up the mountain, the precipitation becomes more and more depleted in oxygen-18, and the ratio of oxygen-18 to oxygen-16 decreases."

Geologists use the ratio of these isotopes, preserved in rock, to infer past elevations.

"If the ratio decreases with time, as the samples get younger, the interpretation would typically be that there has been an increase in elevation at that location," Poulsen said. In fact, that's exactly the conclusion of a series of papers on the uplift history of the Andes published over the past four years. Using oxygen isotopes in carbonate rocks, the authors posited that the central Andes rose about 8,200 to 11,500 feet in three million years, rather than gaining height over tens of millions of years, as other geologists believe.


Other Factors That Influence Oxygen Isotopes


But elevation isn't the only factor that affects oxygen isotope ratios in rain, Poulsen said. "It can also be affected by where the vapor came from and how much it rained—more intense rainfall also causes oxygen-18 to be preferentially rained out." Skeptical of the rapid-rise scenario, he and his colleagues performed climate modeling experiments to address the issue.

"The key result in our modeling study is that we identified an elevation threshold for rainfall," Poulsen said. "Once the Andes reached an elevation greater than 70 percent of the current elevation, the precipitation rate abruptly increased. In our model, the increased precipitation also caused the ratio of oxygen-18 to oxygen-16 to significantly decrease. Our conclusion, then, is that geologists have misinterpreted the isotopic records in the central Andes. The decrease in the ratio is not recording an abrupt increase in elevation; it is recording an abrupt increase in rainfall."

This conclusion is backed up by geochemical and sedimentological data, Poulsen said. "There is evidence that the central Andes became less arid at the same time that the isotope records show a decrease in the ratio of oxygen-18 to oxygen-16."

Wednesday, November 11, 2009

What is Geyser?

A geyser is a vent in Earth's surface that periodically ejects a column of hot water and steam. Even a small geyser is an amazing phenomenon; however some geysers have eruptions that blast thousands of gallons of boiling hot water up to a few hundred feet in the air.

Old Faithful is the world's best known geyser. It is located in Yellowstone National Park (USA). Old Faithful erupts every 60 to 90 minutes and blasts a few thousand gallons of boiling hot water between 100 and 200 feet into the air.


Conditions Required for a Geyser


Geysers are extremely rare features. They occur only where there is a coincidence of unusual conditions. Worldwide there are only about 1000 geysers and most of those are located in Yellowstone National Park (USA).


Conditions Required for Geysers
1) hot rocks below
2) an ample ground water source
3) a subsurface water reservoir
4) fissures to deliver water to the surface


Where are Geysers Found?


Most of the world's geysers occur in just five countries: 1) the United States, 2) Russia, 3) Chile, 4) New Zealand and 5) Iceland. All of these locations are where there is geologically recent volcanic activity and a source of hot rock below.


Countries With Many Active Geysers
1) United States - Yellowstone National Park
2) Russia - Dolina Geiserov
3) Chile - El Tatio
4) New Zealand - Taupo Volcanic Zone
5) Iceland - Many locations


How Often Do Geysers Erupt?


Most geysers erupt irregularly and infrequently. However, a few are known for regular eruptions. The most famous, named "Old Faithful" in recognition of its regular eruptions, is located in Yellowstone National Park (USA) and erupts about every 60 to 90 minutes. More details on the eruption intervals of Yellowstone geysers is given in the table below.


Old Faithful is Getting Slower
Research done at the United States Geological Survey suggests that long-term drought conditions in the Yellowstone area have lenghtened the time interval between Old Faithful's eruptions. The delay is thought to be caused by a smaller water supply.


Yellowstone Geysers
Eruption Intervals, Duration, Heights
LocationAverage IntervalDurationHeight (ft)
Old Faithful
65 or 92 min
1.5-5 min
106-184
Artemisia
irregular
5-25 sec
30
Aurum
2-4 hours
70 sec
20
Baby Daisy
35-55 min
3 min
25
Beehive
12-18 hours
5 min
150+
"Boardwalk"
irregular
5-10 min
20
Castle
12.5 hours
15-20 min
75
Daisy
2.5 hours
3.5 min
75
Depression
5-9 hours
6 min
10
Echinus
irregular
3-5 min
30+
Fan & Mortar
6-10 days?
45 min
100+
Fountain
5.5 hours
9 min
78
Giant
last eruption 12/24/03
1 hour
200+
Giantess
last eruption 4/21/04
4-48 hours
150+
Grand
8.5 hours
8-12 min
160+
Great Fountain
12.5 hours
45 min
70-200+
Lion - initial to intitial
about 8 hours
1-7 min
60
Lion - within series
about 90 min
3-5 min
30
Little Cub
about 55 min
10 min
5
Plate
3.5-4 min
4 min
5
Plume
recent periods of dormancy
1 min
25
Riverside
6.25 hours
20 min
75
Steamboat
last eruptions 4/27/03 and 5/23/05
10+ min
300+
Riverside
6.25 hours
20 min
75
Data from National Park Service
(Measurements done in 2002)

Tuesday, October 27, 2009

Types of Volcanic Eruptions

Volcanic Eruptions


The most common type of volcanic eruption occurs when magma (the term for lava when it is below the Earth’s surface) is released from a volcanic vent. Eruptions can be effusive, where lava flows like a thick, sticky liquid, or explosive, where fragmented lava explodes out of a vent. In explosive eruptions, the fragmented rock may be accompanied by ash and gases; in effusive eruptions, degassing is common but ash is usually not.

Volcanologists classify eruptions into several different types. Some are named for particular volcanoes where the type of eruption is common; others concern the resulting shape of the eruptive products or the place where the eruptions occur. Here are some of the most common types of eruptions:


Hawaiian Eruption


In a Hawaiian eruption, fluid basaltic lava is thrown into the air in jets from a vent or line of vents (a fissure) at the summit or on the flank of a volcano. The jets can last for hours or even days, a phenomenon known as fire fountaining. The spatter created by bits of hot lava falling out of the fountain can melt together and form lava flows, or build hills called spatter cones. Lava flows may also come from vents at the same time as fountaining occurs, or during periods where fountaining has paused. Because these flows are very fluid, they can travel miles from their source before they cool and harden.

Hawaiian eruptions get their names from the Kilauea volcano on the Big Island of Hawaii, which is famous for producing spectacular fire fountains. Two excellent examples of these are the 1969-1974 Mauna Ulu eruption on the volcano’s flank, and the 1959 eruption of the Kilauea Iki Crater at the summit of Kilauea. In both of these eruptions, lava fountains reached heights of well over a thousand feet.


Strombolian Eruption


Strombolian eruptions are distinct bursts of fluid lava (usually basalt or basaltic andesite) from the mouth of a magma-filled summit conduit. The explosions usually occur every few minutes at regular or irregular intervals. The explosions of lava, which can reach heights of hundreds of meters, are caused by the bursting of large bubbles of gas, which travel upward in the magma-filled conduit until they reach the open air.

This kind of eruption can create a variety of forms of eruptive products: spatter, or hardened globs of glassy lava; scoria, which are hardened chunks of bubbly lava; lava bombs, or chunks of lava a few cm to a few m in size; ash; and small lava flows (which form when hot spatter melts together and flows downslope). Products of an explosive eruption are often collectively called tephra.

Strombolian eruptions are often associated with small lava lakes, which can build up in the conduits of volcanoes. They are one of the least violent of the explosive eruptions, although they can still be very dangerous if bombs or lava flows reach inhabited areas. Strombolian eruptions are named for the volcano that makes up the Italian island of Stromboli, which has several erupting summit vents. These eruptions are particularly spectacular at night, when the lava glows brightly.


Vulcanian Eruption


A Vulcanian eruption is a short, violent, relatively small explosion of viscous magma (usually andesite, dacite, or rhyolite). This type of eruption results from the fragmentation and explosion of a plug of lava in a volcanic conduit, or from the rupture of a lava dome (viscous lava that piles up over a vent). Vulcanian eruptions create powerful explosions in which material can travel faster than 350 meters per second (800 mph) and rise several kilometers into the air. They produce tephra, ash clouds, and pyroclastic density currents (clouds of hot ash, gas and rock that flow almost like fluids).

Vulcanian eruptions may be repetitive and go on for days, months, or years, or they may precede even larger explosive eruptions. They are named for the Italian island of Vulcano, where a small volcano that experienced this type of explosive eruption was thought to be the vent above the forge of the Roman smith god Vulcan.


Plinian Eruption


The largest and most violent of all the types of volcanic eruptions are Plinian eruptions. They are caused by the fragmentation of gassy magma, and are usually associated with very viscous magmas (dacite and rhyolite). They release enormous amounts of energy and create eruption columns of gas and ash that can rise up to 50 km (35 miles) high at speeds of hundreds of meters per second. Ash from an eruption column can drift or be blown hundreds or thousands of miles away from the volcano. The eruption columns are usually shaped like a mushroom (similar to a nuclear explosion) or an Italian pine tree; Pliny the Younger, a Roman historian, made the comparison while viewing the 79 AD eruption of Mount Vesuvius, and Plinian eruptions are named for him.

Plinian eruptions are extremely destructive, and can even obliterate the entire top of a mountain, as occurred at Mount St. Helens in 1980. They can produce falls of ash, scoria and lava bombs miles from the volcano, and pyroclastic density currents that raze forests, strip soil from bedrock and obliterate anything in their paths. These eruptions are often climactic, and a volcano with a magma chamber emptied by a large Plinian eruption may subsequently enter a period of inactivity.


Lava Domes


Lava domes form when very viscous, rubbly lava (usually andesite, dacite or rhyolite) is squeezed out of a vent without exploding. The lava piles up into a dome, which may grow by inflating from the inside or by squeezing out lobes of lava (something like toothpaste coming out of a tube). These lava lobes can be short and blobby, long and thin, or even form spikes that rise tens of meters into the air before they fall over. Lava domes may be rounded, pancake-shaped, or irregular piles of rock, depending on the type of lava they form from.

Lava domes are not just passive piles of rock; they can sometimes collapse and form pyroclastic density currents, extrude lava flows, or experience small and large explosive eruptions (which may even destroy the domes!) A dome-building eruption may go on for months or years, but they are usually repetitive (meaning that a volcano will build and destroy several domes before the eruption ceases). Redoubt volcano in Alaska and Chaiten in Chile are currently active examples of this type of eruption, and Mount St. Helens in the state of Washington spent several years building several lava domes.


Surtseyan Eruption


Surtseyan eruptions are a kind of hydromagmatic eruption, where magma or lava interacts explosively with water. In most cases, Surtseyan eruptions occur when an undersea volcano has finally grown large enough to break the water’s surface; because water expands when it turns to steam, water that comes into contact with hot lava explodes and creates plumes of ash, steam and scoria. Lavas created by a Surtseyan eruption tend to be basalt, since most oceanic volcanoes are basaltic.

The classic example of a Surtseyan eruption was the volcanic island of Surtsey, which erupted off the south coast of Iceland between 1963 and 1965. Hydromagmatic activity built up several square kilometers of tephra over the first several months of the eruption; eventually, seawater could no longer reach the vent, and the eruption transitioned to Hawaiian and Strombolian styles. More recently, in March 2009, several vents of the volcanic island of Hunga Ha'apai near Tonga began to erupt. The onshore and offshore explosions created plumes of ash and steam that rose to more than 8 km (5 miles) altitude, and threw plumes of tephra hundreds of meters from the vents.

Friday, October 23, 2009

The causes of tsunami

What causes a tsunami?... A tsunami is a large ocean wave that is caused by sudden motion on the ocean floor. This sudden motion could be an earthquake, a powerful volcanic eruption, or an underwater landslide. The impact of a large meteorite could also cause a tsunami. Tsunamis travel across the open ocean at great speeds and build into large deadly waves in the shallow water of a shoreline.

Subduction Zones are Potential Tsunami Locations

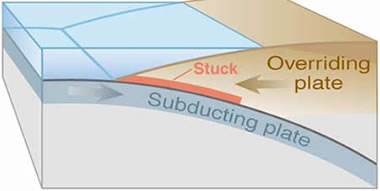
Most tsunamis are caused by earthquakes generated in a subduction zone, an area where an oceanic plate is being forced down into the mantle by plate tectonic forces. The friction between the subducting plate and the overriding plate is enormous. This friction prevents a slow and steady rate of subduction and instead the two plates become "stuck".


Image by USGS


Accumulated Seismic Energy

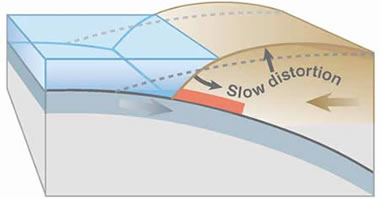
As the stuck plate continues to descend into the mantle the motion causes a slow distortion of the overriding plage. The result is an accumulation of energy very similar to the energy stored in a compressed spring. Energy can accumulate in the overriding plate over a long period of time - decades or even centuries.


Image by USGS


Earthquake Causes Tsunami

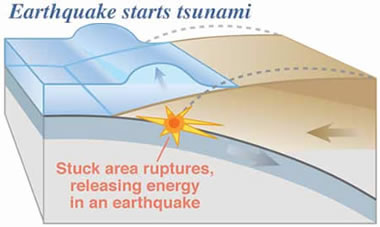
Energy accumulates in the overriding plate until it exceeds the frictional forces between the two stuck plates. When this happens, the overriding plate snaps back into an unrestrained position. This sudden motion is the cause of the tsunami - because it gives an enormous shove to the overlying water. At the same time, inland areas of the overriding plate are suddenly lowered.


Image by USGS


Tsunami Races Away From the Epicenter

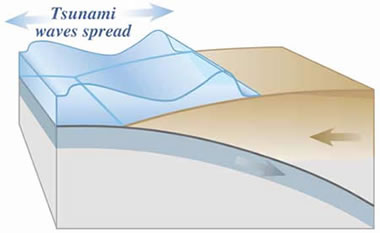
The moving wave begins travelling out from where the earthquake has occurred. Some of the water travels out and across the ocean basin, and, at the same time, water rushes landward to flood the recently lowered shoreline.


Image by USGS


Tsunamis Travel Rapidly Across Ocean Basis

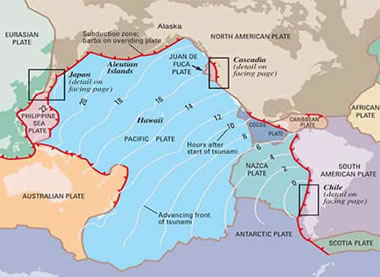
Tsunamis travel swiftly across the open ocean. The map below shows how a tsunami produced by an earthquake along the coast of Chile in 1960 traveled across the Pacific Ocean, reaching Hawaii in about 15 hours and Japan in less than 24 hours.


Image by USGS


Tsunami "Wave Train"

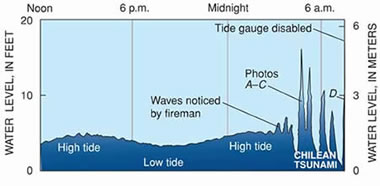
Many people have the mistaken belief that tsunamis are single waves. They are not. Instead tsunamis are "wave trains" consisting of multiple waves. The chart below is a tidal gauge record from Onagawa, Japan beginning at the time of the 1960 Chile earthquake. Time is plotted along the horizontal axis and water level is plotted on the vertical axis. Note the normal rise and fall of the ocean surface, caused by tides, during the early part of this record. Then recorded are a few waves a little larger than normal followed by several much larger waves. In many tsunami events the shoreline is pounded by repeated large waves.


Image by USGS

The material above describes how tsunamis are generated and how they travel rapidly across an ocean basin. For more detailed information on this topic the following websites are recommended.

Thursday, October 8, 2009

Volcanic Ash

What is Volcanic Ash?


Volcanic ash consists of powder-size to sand-size particles of igneous rock material that have been blown into the air by an erupting volcano (see image at right). The term is used for the material while it is in the air, after it falls to the ground and sometimes after it has been lithified into rock. The terms "volcanic dust" and "volcanic ash" are both used for the same material, however "volcanic dust" is more appropriately used for powder-size material.

Tephra / Pyroclastic Terminology

Particle Name

Particle Size

Blocks / Bombs
over 64 mm (2.5 inches)
Lapilli
under 64 mm (2.5 inches)
Volcanic Ash
under 2 mm (.079 inches)
Volcanic Dust
(Fine Volcanic Ash)
under 0.063 mm (0.0025 inches)
"Tephra" and "pyroclastics" are general terms used in reference to particles of igneous rock material of various sizes that have been ejected from volcanoes. They are classified by size. The terms "ash" and "dust" communicate a specific size of tephra or pyroclastic particles. These are summarized in the table above.


Properties of Volcanic Ash


At first glance, volcanic ash looks like a soft, harmless powder (see image at right). Instead, volcanic ash is a rock material with a hardness of about 5+ on the Mohs Hardness Scale. It is composed of irregularly-shaped particles with sharp, jagged edges (see image at right). Combine the high hardness with the irregular particle shape and volcanic ash can be an abrasive material. This gives these tiny particles the ability to damage aircraft windows, be an eye irritant, cause unusual wear on moving parts of equipment that they come in contact with and cause many other problems discussed below in the "Impact of Volcanic Ash" section.

Volcanic ash particles are very small in size and have a vesicular structure with numerous cavities (see image at right). This gives them a relatively low density for a rock material. This low density, combined with the very small particle size allows volcanic ash to be carried high into the atmosphere by an eruption and carried long distances by the wind. Volcanic ash can cause problems a long distance from the erupting volcano.

Volcanic ash particles are insoluble in water. When they become wet they form a slurry or a mud that can make highways and runways slick. Wet volcanic ash can dry into a solid, concrete-like mass. This enables it to plug storm sewers and stick in the fur of animals that are in the open when ash falls at the same time as rain.


Ash Eruptions and Ash Columns


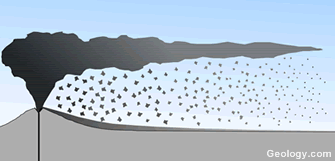
Some magmas contain enormous amounts of dissolved gas under very high pressures. When an eruption occurs the confining pressure on these gases is suddenly released and they expand rapidly, rushing from the volcanic vent and carrying small bits of magma with them. Ground water near a magma chamber can be flashed into steam with the same result. These are the source of ash particles for some eruptions. The enormous quantity of hot, escaping, expanding gas rushing from the vent can drive an eruption column of ash and hot gases high into the air.

The image at right shows a portion of the ash column produced by the May, 1980 eruption of Mount St. Helens. In that eruption, the explosive release of hot volcanic gases into the atmosphere produced a column of rising tephra, volcanic gases and entrained air that rose to an altitude of 22 kilometers in less than ten minutes. Then, strong prevailing winds carried the ash to the east at about 100 kilometers per hour. In less than four hours, ash was falling on the city of Spokane about 400 kilometers away from the vent. Two weeks later dust from the eruption had been carried around the Earth.

The Mount St. Helens eruption was exceptional in its size and intensity. A more typical ash release is shown in the image at the top right of this page. In that image, Cleveland Volcano, located on Chuginadak Island in the Aleutian Island Chain of Alaska, releases a small ash plume that within minutes detatches from the volcano and is carried away by the wind.


Ash Plumes, Ashfalls and Ash Fields:


Once ash is released into the air by a volcano, the wind has an opportunity to move it. This movement, along with air turbulence, work to distribute the suspended ash over a broad area. These clouds of ash being moved by the wind are known as ash plumes. An image at below right shows an ash plume produced by the eruption of Chaitén Volcano in southern Chile on May 3, 2008. This plume begins in Chile, crosses Argentina and extends hundreds of kilometers out over the Atlantic Ocean, spreading out as it travels.

As an ash plume moves away from the volcanic vent it no longer has the rush of escaping gases to support it. The unsupported ash particles begin to fall out. The largest ash particles fall out first and the smaller particles remain suspended longer. This can produce an ashfall deposit on the ground below the ash plume. These ashfall deposits are generally thickest near the vent and thin with distance. A map showing the ash distribution from the May 18, 1980 eruption of Mount St. Helens is shown at right.

Ashfall deposits are generally thick and coarse in particle size near the volcano. However, at distance the deposit gets thinner and finer.

An ash field is a geographic area where the ground has been blanketed by the fallout of an ash plume. An image at below right shows an ash field east of Chaitén Volcano in southern Chile from May, 2008. The white groundcover of ash can clearly be seen.

The Impact of Volcanic Ash:


Volcanic ash presents numerous hazards to people, property, machinery, communities and the environment. Several of these are detailed below.


Impact on Human Health :


People exposed to falling ash or living in the dusty environment after an ash fall can suffer a number of problems. Respiratory problems include nose and throat irritation, coughing, bronchitis-like illness and discomfort while breathing. These can be reduced with the use of high-efficiency dust masks but exposure to the ash should be avoided if possible.

Long term problems might include the development of a disease known as "silicosis" if the ash has a significant silica content. The U.S. National Institute of Occupational Safety and Health recommends specific types of masks for those exposed to volcanic ash. Anyone who already suffers from problems such as bronchitis, emphysema, or asthma should avoid exposure.

Dry volcanic ash can stick to a moist human eye and the tiny ash particles quickly cause eye irritation. This problem is most severe among people who wear contact lenses. Some skin irritation is reported by people in ashfall areas, however, the number of cases and their severity are low.


Impact on Agriculture:


Livestock suffer the same eye and respiratory problems that were described above for humans. Animals that feed by grazing could become unable to eat if the ash covers their food source. Those who eat from an ash-covered food source often suffer from a number of illnesses. Farmers in ashfall areas may need to provide supplementary feed to their animals, evacuate them or send them to early slaughter.

An ashfall of just a few millimeters usually does not cause severe damage to pastures and crops. However, thicker ash accumulations can damage or kill plants and pasture. Thick accumulations can damage the soil by killing microphytes and blocking the entry of oxygen and water. This can result in a sterile soil condition.


Impact on Buildings:


Dry ash weighs about ten times the density of fresh snow. A thick ashfall on the roof of a building can overload it and cause it to collapse (see image at below right). Most buildings are not designed to support this additional weight.

Immediately after a heavy ashfall one of the priority jobs is clearing the ash from the roofs of buildings. If rain falls before the ash is removed it can be absorbed by the ash and increase the weight. Wet ash can have a density of twenty times that of fresh snow.

Volcanic ash can fill the gutters on a building and clog the downspouts. The ash alone can be very heavy and if it becomes wet from rain the weight will often pull gutters from houses. Ash in combination with water can be corrosive to metal roofing materials. Wet ash is also a conductor and when accumulated around the external electrical elements of a building it can lead to serious injury or damage.

Air conditioners and air-handling systems can fail or be damaged if their filters are clogged or their vents are covered by volcanic ash. Moving parts on equipment can be worn rapidly if abrasive ash gets between them.


Impact on Appliances:


Fine ash and dust can infiltrate into buildings and cause problems with appliances. The abrasive ash can produce unusual wear on the moving parts within electric motors. Vacuum cleaners, furnaces and computer systems are especially vulnerable because they process lots of air.


Impact on Communications:


Volcanic ash can have an electrical charge that interferes with radio waves and other broadcasts transmitted througth the air. Radio, telephone and GPS equipment may not be able to send or receive signals with an erupting volcano nearby. The ash can also damage physical facilities such as the wires, towers, buildings and equipment needed to support communications.


Impact on Power Generating Facilities:


Volcanic ash can cause a shutdown of power generating facilities. These facilities are sometimes turned off to avoid damage from the ash. They can remain down until the ash has been removed. This protects essential equipment from failure but disrupts power service for millions of people.


Impact on Ground Transportation:


The initial impact upon transportation is a limit on visibility. The ash fills the air and blocks sunlight. It can be as dark as night in the middle of the day. The ash also covers road markings. Just one millimeter of ash can obscure the center and baselines of a highway.

Another impact is on cars. They process enormous amounts of air which will contain volcanic dust and ash. This initially gets captured by the air filter but it can quickly be overwhelmed. Then abrasive dust goes into the engine to damage carefully machined parts and clog tiny openings.

Volcanic ash accumulates on the windshields of cars, creating a need to use the wipers. If the wipers are used the abrasive ash between the windshield and the wipers can scratch the window, sometimes producing a frosted surface that is impossible to see through.

Volcanic dust and ash covering the roads can result in a loss of traction. If the roads get wet the dry ash turns into a very slippery mud. Roads and streets must be shoveled as if a snow that does not melt has fallen.


Impact on Air Transportation:


Modern jet engines process enormous amounts of air. They pull air into the front of the engine and exhaust it out the back. If volcanic ash is pulled into a jet engine it can be heated to temperatures that are higher than the melting temperature of the ash. The ash can melt in the engine and the soft sticky product can adhere to the inside of the engine. This restricts airflow through the engine and adds weight to the plane.

Volcanic ash has led to engine failure on a few planes. Fortunately the pilots were able to land safely with their remaining engines. Today, volcanoes are monitored for signs of eruption and planes are routed around areas that might contain airborne ash.

Volcanic ash suspended in the air can have an abrasive effect on planes flying through it at hundreds of kilometers per hour. At these speeds, ash particles impacting the windshield can sandblast the surface into a frosted finish that obscures the pilot's view. The sandblasting can also remove paint and pit metal on the nose and on the leading edges of wings and navigation equipment.

At airports the same problems are encountered with runways as are seen on roads. The markings on runways can be covered with ash. Planes can lose traction upon landing and take-off. And, the ash must be removed before operations return to normal.

The International Civil Aviation Organization recognized the need to keep pilots and air traffic controlers informed of volcanic hazards. To do that they worked with government agencies to establish several Volcanic Ash Advisory Centers. These centers monitor volcanic activity and report on ash plumes within their monitoring area.

Impact on Water Supply Systems:


Water supply systems can be impacted by ashfalls. Where a community utilizes an open water supply such as a river, reservoir or lake, the fallen ash will become a suspended material in the water supply which must be filtered out before use. Processing water with suspended abrasive ash can be damaging to pumps and filtration equipment.

The ash can also cause temporary changes in the chemistry of the water. Ash in contact with water can lower the pH and increase the concentration of ions leached from the ash material. These include: Cl, SO4, Na, Ca, K, Mg, F and many others.


Impact on Waste Water Systems:


Ash falling on city streets will immediately enter the storm sewer system. If ash-laden sewer water is processed the suspended ash can overload equipment and filters and cause damage to pumps and valves. It also becomes a disposal problem. Mud or slurry of ash can harden into a material similar to concrete.


Planning for Volcanic Ash


Communities located near or downwind of volcanoes with a potential of producing ash eruptions should consider the potential impact of volcanic ash and plan for ways to deal with it and minimize its impact. It is much easier to become educated about a problem and take action in advance than it is to face an enormous problem without warning.

Tuesday, September 29, 2009

USGS Digital Data Series DDS-9

U.S. GEOLOGICAL SURVEY DIGITAL DATA SERIES DDS-9
National Geophysical Data Grids:
Gamma-Ray, Gravity, Magnetic, and Topographic
Data for the Conterminous United States

FILE DESCRIPTIONS
GRID FILE INFORMATION


The data published in the \ASCII directory on this CD-ROM consist of regular grids of ASCII values.Each grid has a different origin and sample spacing as defined in its first record, the header.The grid format is explained in detail below.Each grid represents data that have been projected from latitude and longitude coordinates into map coordinates of kilometers.Thus, the x-origin and y-origin values given in the header represent the distance in kilometers from the central meridian and base latitude of the geographic projection (discussed below) to the lower left corner of the grid.
Binary versions of these grid files, suitable for processing on IBM or compatible personal computers using the potential-field software contained on this CD-ROM, are located in the \DOSBIN directory on this CD-ROM.Use the EXTRACT BINARY GRID FILES submenu to access these grid files.For more information on the binary grid file format and the potential-field software, access the POTENTIAL-FIELD SOFTWARE submenu from the MAIN menu.
Projection information

All grids on this CD-ROM have been projected by using an Albers equal-area conic projection with standard parallels of 29.5 degrees and 45.5 degrees north.A central meridian of 96 degrees west and a base latitude of 0 degrees were used.The projection is referenced to the Clarke 1866 ellipsoid, which has an equatorial radius of 6378.2064 km and a polar radius of 6356.5838 km.
Grid format

Each ASCII grid consists of two header records followed by a series of data records.The first header record contains 56 alphanumeric characters of data identification, 8 alphanumeric characters containing the name of the computer program that created the grid, the integer number of columns in the grid, and the integer number of rows in the grid.The second header record contains a dummy integer value of 1, the x-coordinate in kilometers of the first (leftmost) column, the distance in kilometers between columns of the grid, the y-coordinate in kilometers of the first (bottommost) row of the grid, and the distance in kilometers between rows of the grid.

Each data record contains five values in scientific notation.The bottommost row is presented first, starting from the leftmost column.The first value in each row is a dummy value, usually zero (0.000000000E+00). If a row ends in the middle of a record, the record is padded with zeros. Areas of the grid containing no data are represented by a special value, 0.999999968E+38.

The gamma-ray data grids

Aerial gamma-ray surveys measure the gamma-ray flux produced by the radioactive decay of the naturally occurring elements K-40, U-238, and Th-232 in the top few centimeters of rock or soil (Duval, Cook, and Adams, 1971).If the gamma-ray system is properly calibrated (for example, see Grasty and Darnley, 1971), the data can be expressed in terms of the estimated concentrations of the radioactive elements.The potassium concentration data are usually expressed in units of percent potassium (percent K), uranium as parts per million equivalent uranium (ppm eU), and the thorium as parts per million equivalent thorium(ppm eTh).The term equivalent is used because the technique actually measures the gamma-ray flux from the decay of bismuth (Bi-214), which is a decay product of U-238, and from the decay of thallium (Tl-208), which is a decay product of Th-232.Radioactive disequilibrium in the thorium decay series may cause the measured equivalent uranium and equivalent thorium to differ from the actual uranium andthorium present in the surface rocks and soils. Because Rn-222 is a daughter product of the U-238 decay series, the U-238 concentrations can also be used to estimate the amounts of Rn-222 in the near-surface soil gas.

During the period 1975-83, the U.S. Department of Energy carried out the National Uranium Resource Evaluation (NURE) Program, which included aerial gamma-ray surveys of most of the conterminous United States.Although many of the airborne gamma-ray systems used to make these surveys were calibrated, many of the earlier surveys were done without calibration and conversion to the concentrations of the radioactive elements.Detailed examinations of the digital data available on magnetic tape also showed that many of the "calibrated" surveys do not match the data from other "calibrated" surveys of adjacent areas.For these reasons, the data must be corrected to obtain a consistent data base for the conterminous United States.
Because uranium, thorium, and potassium concentration data are useful in geologic studies and because the NURE data are the only nationwide data base on the natural radiation environment, the U.S. Geological Survey (USGS) reprocessed the aerial gamma-ray data to produce maps showing surface concentrations of potassium, uranium, and thorium for the conterminous United States.These maps have been released as USGS Open- File Reports (Duval and others, 1989, 1990).Some of the reprocessed data have also been released in profile form (Duval, 1995).

The magnetic anomaly data grid

Magnetic anomalies are produced by variations in the distribution of iron minerals, usually magnetite, in the rocks of the Earth's crust.Igneous and metamorphic rocks can be very magnetic.By comparison, sedimentary rocks are usually nonmagnetic.Magnetic anomalies therefore provide a way of mapping exposed and buried crystalline rocks.
The grid of magnetic anomaly data for the conterminous United States and adjacent marine areas (Godson, 1986) was created from digitized contours of the east half of the Composite Magnetic Anomaly Map of the United States, Part A (U.S. Geological Survey, 1982), and the Composite Magnetic Anomaly Map of the Conterminous United States West of 96 Degrees Longitude (Bond and Zietz, 1987),with additional data used in the compilation of the Magnetic Anomaly Map of North America (Geological Society of America, Committee for the Magnetic Anomaly Map of North America, 1987).A regional gradient present in the 1982 map was removed by using a corrected geomagnetic reference field (Godson, 1986).The data, originally gridded on a 2-km interval using the spherical Transverse Mercator projection of the Magnetic Anomaly Map of North America, were reprojected to the Albers projection used on this CD-ROM and regridded on a 2-km interval using a minimum curvature gridding program (Webring, 1981).An interpretation of the 1982 anomaly map was presented by Hinze and Zietz (1985).

The Bouguer gravity anomaly data grid

Gravity anomalies are produced by density variations within the rocks of the Earth's crust and upper mantle.Mapping of these density variations is the primary use of gravity anomalies.
Gravity measurements made on the surface of the Earth must be corrected in various ways before they can be made into an anomaly map.The free-air correction reduces the measurement to sea level by assuming that there is no intervening mass.The simple Bouguer correction accounts for the intervening mass as a uniform slab of constant density, and the complete Bouguer correction includes the effects of constant density topography within 166.7 km of the measurement location.A gravity reference field is subtracted from the corrected measurements to produce the free-air, simple Bouguer, or complete Bouguer anomaly.
The grid of gravity data for the conterminous United States and adjacent marine areas (Godson and Scheibe, 1982; Godson, 1985) was constructed from Defense Mapping Agency gravity data files.The onshore data consisted of nearly one million Bouguer gravity anomaly values computed by using a reduction density of 2.67 grams per cubic centimeter.The offshore data consisted of approximately 800,000 free-air gravity anomaly values. Because the Bouguer anomaly equals the free-air anomaly at sea level, there is no discontinuity in the gridded data at the shoreline.All computations were performed by using the International Gravity Standardization Net of 1971 (International Association of Geodesy, 1974) and the 1967 Geodetic Reference System formula for theoretical gravity (International Association of Geodesy, 1971).
In areas of substantial relief, terrain corrections were computed about each station location at radial distances of 0.895 km to 166.7 km by using a density of 2.67 grams per cubic centimeter.The data were projected and gridded on a 4-km interval using minimum curvature (Webring, 1981).The gridding procedure resulted in the extrapolation of grid values up to 40 km beyond the limits of the data; therefore, values around the edges should be viewed with caution.These gridded data were published in map form as the Gravity Anomaly Map of the United States (Society of Exploration Geophysicists, 1982).This map was further discussed by O'Hara and Lyons (1985) and Kane and Godson (1985, 1989).

The isostatic residual gravity anomaly data grid

Isostatic residual gravity anomaly maps are produced by subtracting long- wavelength anomalies produced by masses deep within the crust or mantle from the Bouguer anomalymap.The long-wavelength anomalies are assumed to result from isostatic compensation of topographic loads.Isostatic residual gravity anomaly maps therefore reveal more clearly than Bouguer anomaly maps the density distributions within the upper crust that are of interest in many geologic and tectonic studies.
The grid of isostatic residual gravity anomaly data (Simpson and others, 1986) was produced from the grid of Bouguer gravity anomaly data (Godson and Scheibe, 1982) by using an Airy-Heiskanen compensation model (Heiskanen and Moritz, 1967) with three parameters.The depth to the compensating root at sea level was chosen to be 30 km.The density contrast across the root was chosen to be 0.35 grams per cubic centimeter, and the density of the topography was chosen to be 2.67 grams per cubic centimeter.Other reasonable choices of these parameters would produce similar-looking residual maps.
The computer program and topographic data sets used to produce the data
grid were described by Simpson and others (1983a,b). The data were
published in map form by Jachens and others (1985).Interpretations of the
isostatic residual gravity anomaly map were presented by Simpson and others
(1986) and by Jachens and others (1989).

The topographic data grid

The topographic data grid for the conterminous United States and adjacent areas was constructed from 30x30 second digital terrain files used by the U.S. Geological Survey for the reduction of gravity data.Elevations are in meters; sea level elevations are listed as 1 meter.

The topographic-bathymetric data grid

The topographic and bathymetric data grid for the conterminous United States and adjacent areas was constructed from 5x5 minute North American topographic data and 5x5 minute Synthetic Bathymetric Profiling System data available from the National Oceanic and Atmospheric Administration.The data were interpolated onto an 8x8 km grid in the Albers projection (Simpson and others, 1983b).Elevation units are in meters relative to sea level.

Sunday, September 27, 2009

Mount Vesuvius - Italy


Mount Vesuvius - Italy


Article by Jessica Ball

Mount Vesuvius Introduction


Vesuvius is the only active volcano in mainland Europe, and has produced some of the continent’s largest volcanic eruptions. Located on Italy’s west coast, it overlooks the Bay and City of Naples and sits in the crater of the ancient Somma volcano. Vesuvius is most famous for the 79 AD eruption which destroyed the Roman cities of Pompeii and Herculaneum. Though the volcano’s last eruption was in 1944, it still represents a great danger to the cities that surround it, especially the busy metropolis of Naples.


Map: Where is Vesuvius?
location map for Vesuvius volcano
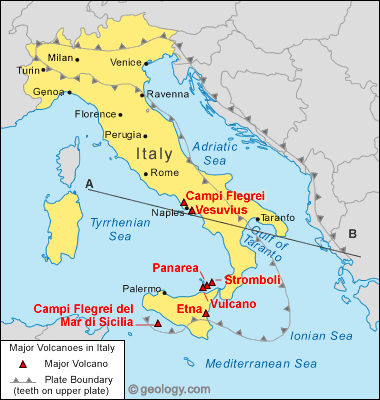
Map showing the location of Mount Vesuvius on the west coast of Italy. Map by Geology.com and MapResources. Nearby Volcanoes: EtnaStromboli


Mount Vesuvius: Plate Tectonic Setting


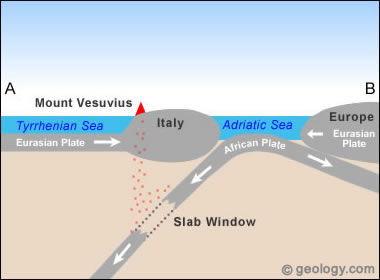
Vesuvius is part of the Campanian volcanic arc, a line of volcanoes that formed over a subduction zone created by the convergence of the African and Eurasian plates. This subduction zone stretches the length of the Italian peninsula, and is also the source of other volcanoes like Mount Etna, the Phlegraean Fields (Campi Flegrei), Vulcano, and Stromboli. Under Vesuvius, the lower part of the subducting slab has torn and detached from the upper part to form what is called a "slab window". This makes Vesuvius’ rocks slightly different chemically from the rocks erupted from the other Campanian volcanoes.

Mount Vesuvius: Eruption History


Mount Vesuvius has experienced eight major eruptions in the last 17,000 years. The 79 AD eruption is oneof the most well known ancient eruptions in the world, and may have killed more than 16,000 people. Ash, mud and rocks from this eruption buried the cities of Pompeii and Herculaneum. Pompeii is famous for the casts the hot ash formed around victims of the eruptions. The unfortunate people suffocated on ash in the air, which then covered them and preserved amazing details of their clothing and faces.

Starting in 1631, Vesuvius entered a period of steady volcanic activity, including lava flows and eruptions of ash and mud. Violent eruptions in the late 1700s, 1800s and early 1900s created more fissures, lava flows, and ash-and-gas explosions. These damaged or destroyed many towns around the volcano, and sometimes killed people; the eruption of 1906 had more than 100 casualties. The most recent eruption was in 1944 during World War II. It caused major problems for the newly-arrived Allied forces in Italy when ash and rocks from the eruption destroyed planes and forced evacuations at a nearby airbase.

San Andreas Fault


The San Andreas Fault is the sliding boundary between the Pacific Plate and the North American Plate. It slices California in two from Cape Mendocino to the Mexican border. San Diego, Los Angeles and Big Sur are on the Pacific Plate. San Francisco, Sacramento and the Sierra Nevada are on the North American Plate. And despite San Francisco’s legendary 1906 earthquake, the San Andreas Fault does not go through the city. But communities like Desert Hot Springs, San Bernardino, Wrightwood, Palmdale, Gorman, Frazier Park, Daly City. Point Reyes Station and Bodega Bay lie squarely on the fault and are sitting ducks.

The San Andreas Fault is a transform fault. Imagine placing two slices of pizza on the table and sliding them past one another where they touch along a common straight edge. Bits of pepperoni from one side crumble across the boundary onto the anchovy side. The same thing happens with the fault, and the geology and landforms along the mighty rift are extremely complicated.

The plates are slowly moving past one another at a couple of inches a year - about the same rate that your fingernails grow. But this is not a steady motion, it is the average motion. For years the plates will be locked with no movement at all as they push against one another. Suddenly the built-up strain breaks the rock along the fault and the plates slip a few feet all at once. The breaking rock sends out waves in all directions and it is the waves that we feel as earthquakes.


Google Map of the San Andreas
Zoom in on the Fault!
In many places like the Carrizo Plain (San Luis Obispo County) and the Olema Trough (Marin County), the fault is easy to see as a series of scarps and pressure ridges. In other places, it is more subtle because the fault hasn’t moved in many years and is covered with alluvium, or overgrown with brush. In San Bernardino and Los Angeles Counties, many of the roads along the fault cut through great mountains of gouge, the powdery, crumbled rock that has been pulverized by the moving plates.

The hallmark of the San Andreas Fault is the different rocks on either side of it. Being about 28 million years old, rock from great distances have been juxtaposed against rocks from very different locations and origins. The Salinian block of granite in central and northern California originated in Southern California, and some even say northern Mexico. Pinnacles National Monument in Monterey County is only half of a volcanic complex, the other part being 200 miles southeast in Los Angeles County and is known as the Neenach Volcanics.

There are many myths and legends about the San Andreas Fault, the biggest being that it will one day crack and California will slide into the sea. WRONG! It won’t happen and it can’t happen. Nor is there any thing such as “earthquake weather” or preferred times of day when earthquakes hit.

The San Andreas Fault is more accessible than any other fault in the world. With California’s large population and temperate climate, there are many roads that snake along the fault. They are uncrowded and peaceful, perfect for family outings. There is abundant camping, bird watching, wild flowers and wildlife, rock collecting and natural beauty along the way. State and National parks are strung along the fault like beads on a string. All it takes is a good map, a comfortable car and a desire to see the world’s most famous fault.

By David K. Lynch,